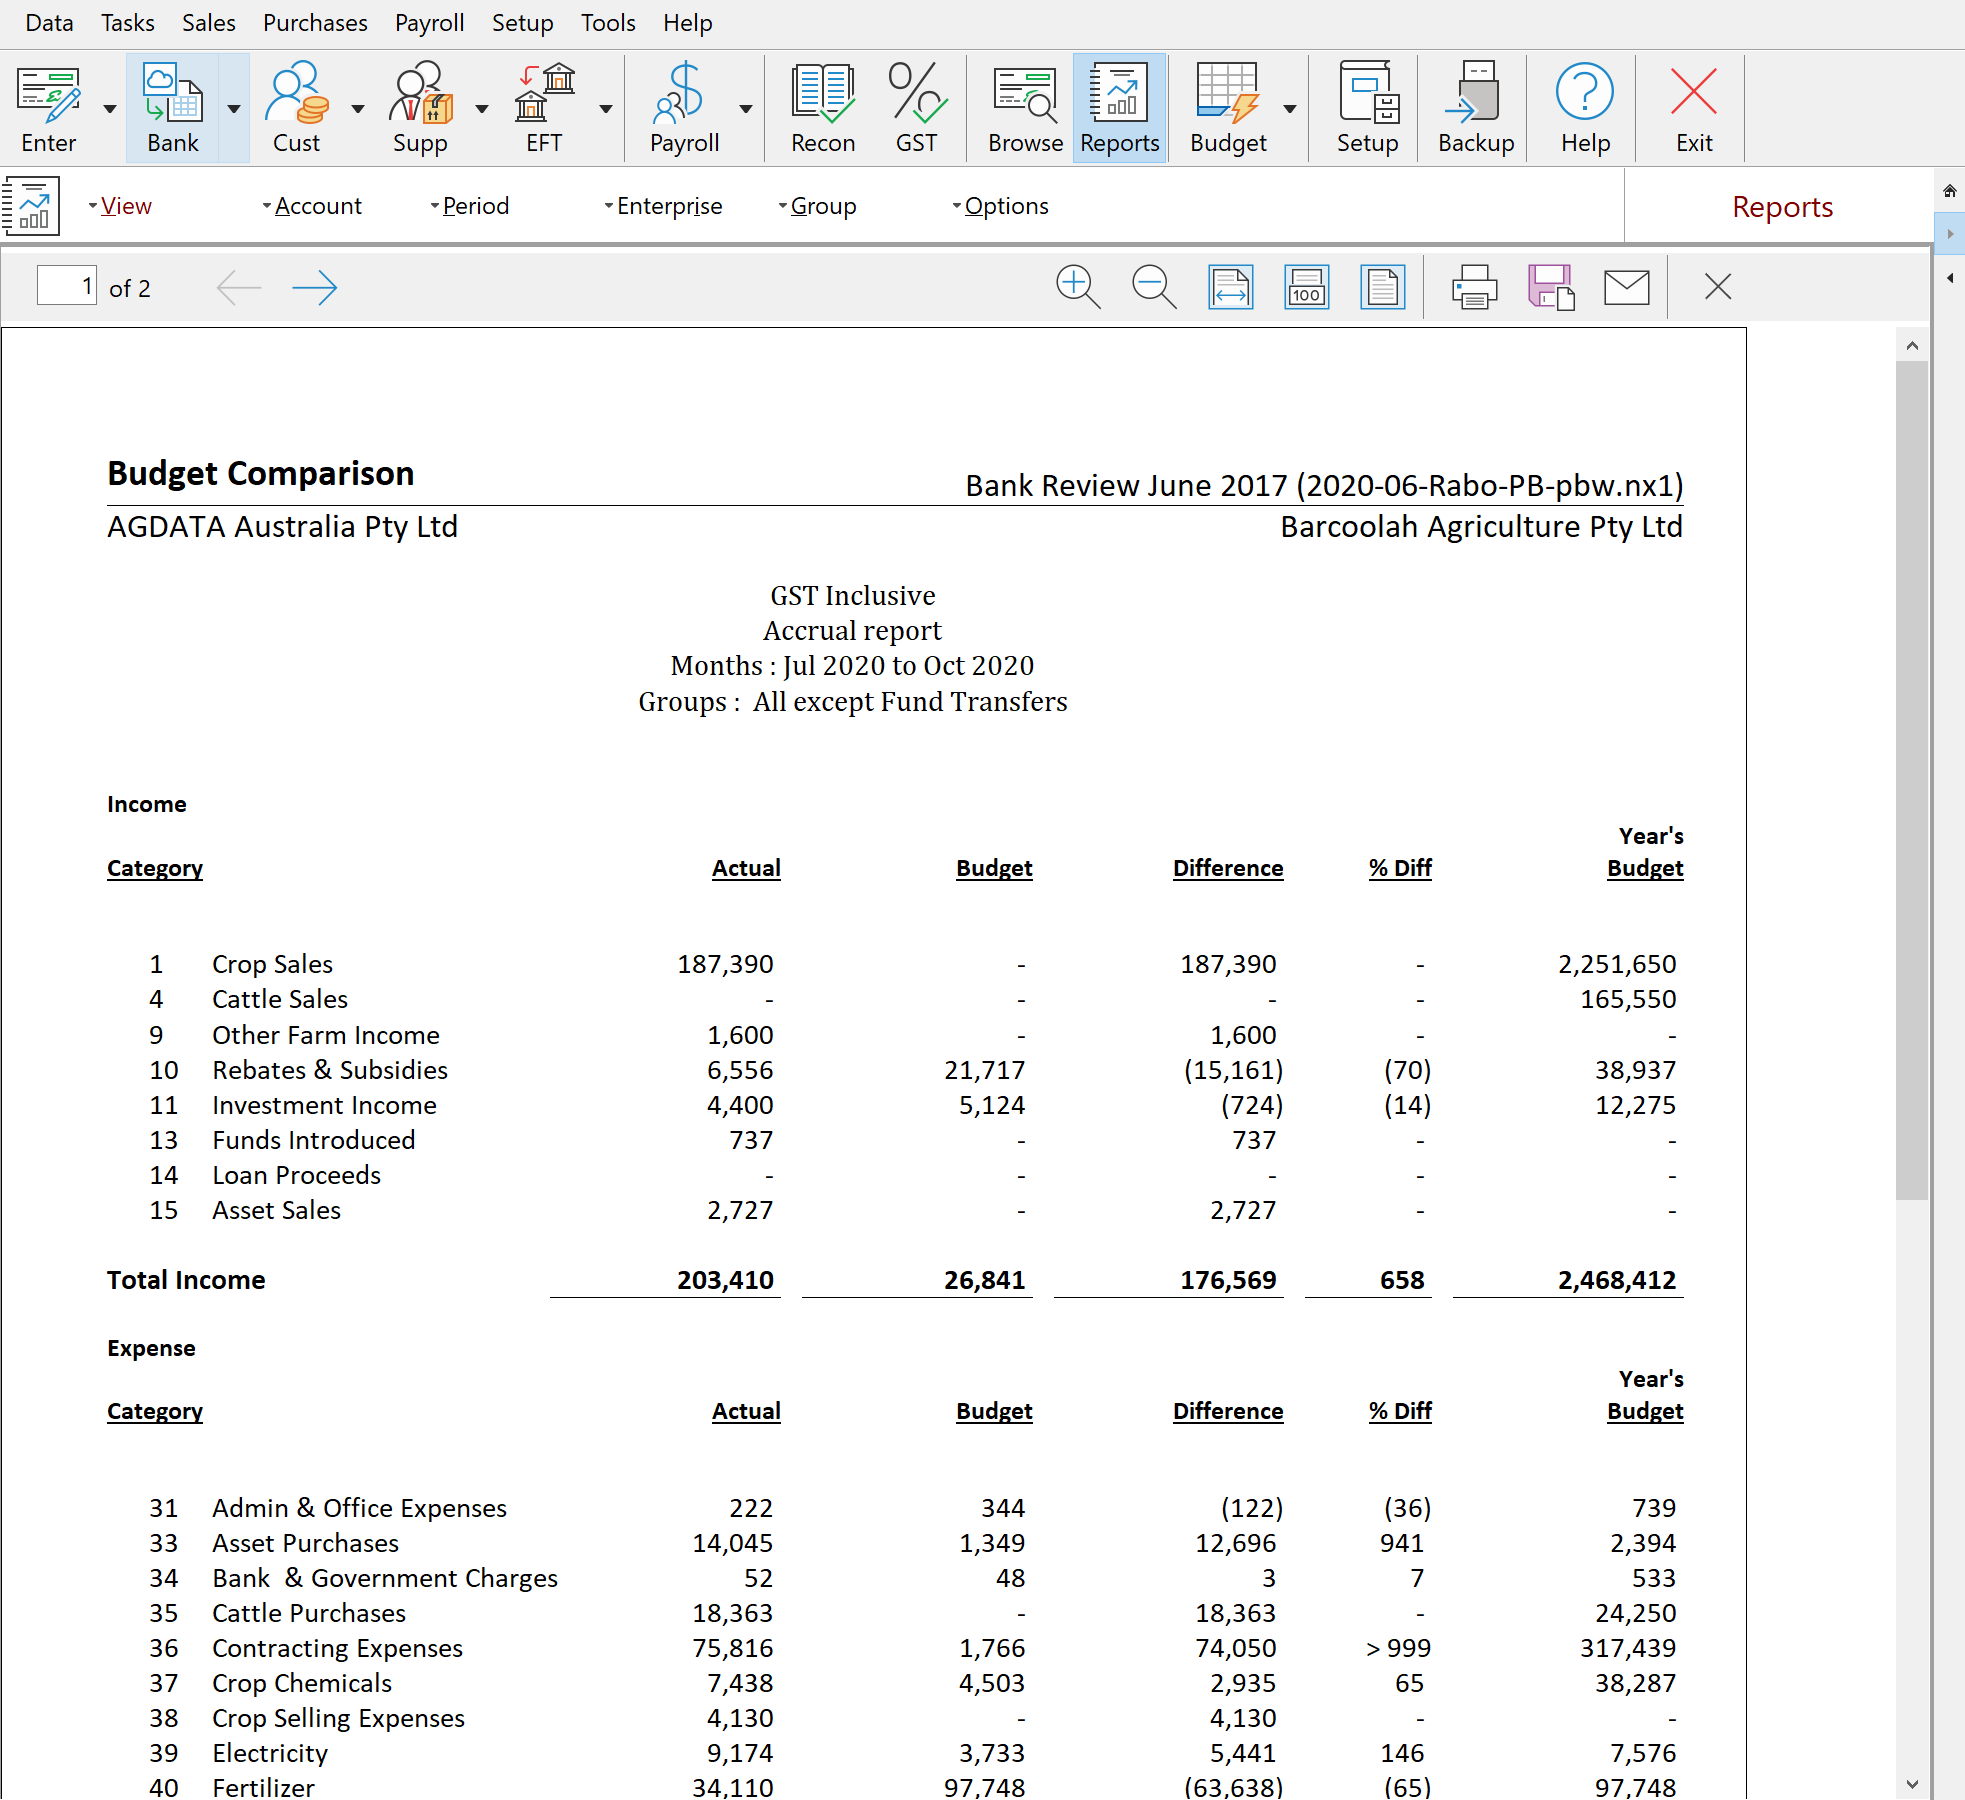
A Budget Comparison report enables you to compare your actual figures versus those that you have budgeted for using Budget Planner or Power Budgets.

If you select a particular month for the report, the comparison between actual and budget is for that month only. Similarly, a period-to-date report compares only the amounts up to and including the current month.
Actual Column: The report lists each cashbook category with its balance for the specified months.
Budget Column: This column shows the total budget amount for the month or months selected for the report.
Options
The Options menu allows the user to choose what is required in the rest of the report. Options available:
Order by Enterprises: Order the results of the Report by Enterprise.
Order Groups: Orders the results of the Report by Group.
Show Cents: By default the report shows only whole dollar amounts. Turn this option on to see cents.
Show Latest month: Shows the latest months actual and budget figures along with the year to date total.
Show Difference (Actual - Budget): Calculates the difference between Actual and Budget figures.
Show Variance: Shows the variance between the actual and budget figures for the selected month or months. A negative variance amount indicates an undesirable result, that is, either an over budget in expenditure or an under budget in income.
New Page for Each Section: Separates Income, Expense and the Cash Flow summary figures onto different pages.
Show Quantity: Shows the quantity and unit type for Actual, Budget and Difference where there is a valid quantity to show.
GST Inclusive/ Exclusive/ Claimable Exclusive: Allows the user to include/exclude GST in the report.
Available Budgets: Allows the user to choose which budget to include in the report.