The options menu allows you to customise the charts to enhance their presentation or the quantity of information they display. The main Options menu contains a series of items upon which there are a number of sub menu:
•Grid - Turns the chart grid on or off.
•Gradient – Gives a background shading to the chart.
•Labels – Text labels attached to each point on the chart to give information on the chart point. Selecting Labels produces the following sub menu.
oVisible – Turns labels on or off.
oDefault- Sets the default labels for the chart. This is % for Pie charts and value for all others.
oValue – Gives the value on the label as the current unit of measure for the chart items.
oPercent – Gives the labels as a percentage of the total.
oLabel – Gives the label the same content as the horizontal axis (i.e. the period).
oLabel Percent – Displays both the percentage value and the horizontal axis name in the label.
oLabel Value – Displays both the current unit of measure and the horizontal axis name in the label.
oPercent Total – Displays the percentage of the total and the total on the label.
oLabel Percent and Total – Gives the label the same content as the horizontal axis as well as displaying the percentage of the total figure and the total figure.
oLegend – Allows for the customisation of the chart legend and displays the following sub menu options.
▪Visible – Turns the legend on or off.
▪Text Only – Displays only the text of the legend.
▪Text then Value – Displays the text for the legend and the value of the items used in the legend.
▪Percent then Text – Displays the value of the items as a percentage and displays the text for the legend.
▪Text then Percent – Display the reverse form of the option above.
oBar Options – Allows for the customisation of bar charts and displays the following sub menu options.
▪Behind One Another – This option displays the bar charts stacked one behind the other.
▪Side by Side – Displays bar charts side by side
▪Stacked – Displays the bar chart values stacked on top of each other to give the total for each month.
▪100% Stacked – Displays the bar chart stacked with each value given as a percentage of 100% with the sum of all equalling 100%.
oFormats – Allows the user to customise the format of the value being presented (i.e. number of decimal places). The selection breaks down into several levels of sub menus.
▪Percent – Selected to give percent options.
❖No Decimal Places (i.e. 0%)
❖One Decimal Place (i.e. 0.0%)
❖Two Decimal Places (i.e. 0.00%)
▪Multi Chart – Used when displaying multiple charts on the one set of axis.
❖Align Max and Min Values – Sets Y-axis scales to display the max values at the top of the chart.
❖Stretch Last Chart
▪Y – Label – Allows changes in the presentation of the Y Label.
❖Use Dollar Sign
❖Whole Dollars Only (i.e. $0)
❖Use Dollars and Cents (i.e. $0.00) |
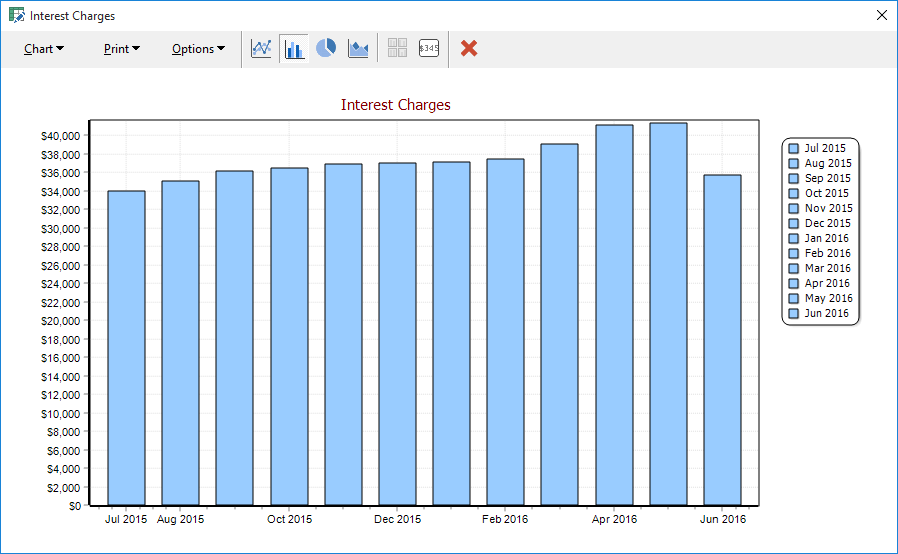
 icon from the toolbar. The chart displayed is for the current active row on the sheet. Hence if you wish to chart a particular cell or row simply select it prior to selecting the chart icon.