A comparative-ratio analysis can help you identify and quantify your business’s strengths and weaknesses, evaluate its financial position and understand the risks you may be taking.
Although ratios report mostly on past performances, they can be predictive, too, and provide lead indications of potential problem areas.
Ratio analysis is primarily used to compare a business’s financial figures over a period of time — a method sometimes called trend analysis. Through trend analysis, you can identify trends and adjust your business practices accordingly. You can also see how your ratios stack up against other businesses.
If you are making a comparative analysis of a business’s financial statements over a certain period of time, make an appropriate allowance for any changes in accounting policies that occurred during the same time span.
The use of Common Mapping Codes
The Common Mapping Codes (CMC) provide the basis for production of the ratios report, and later, other reports of common format. These reports have a common format so that they can be compared with the same report from other Phoenix users. The CMC provides a means of standardising certain reports without compromising the individual users ability to configure Phoenix to his/her own individual requirements.
A Common Mapping Code is allocated to each sub-category, and will define where values allocated to that category will appear in standard format reports (ratio report).
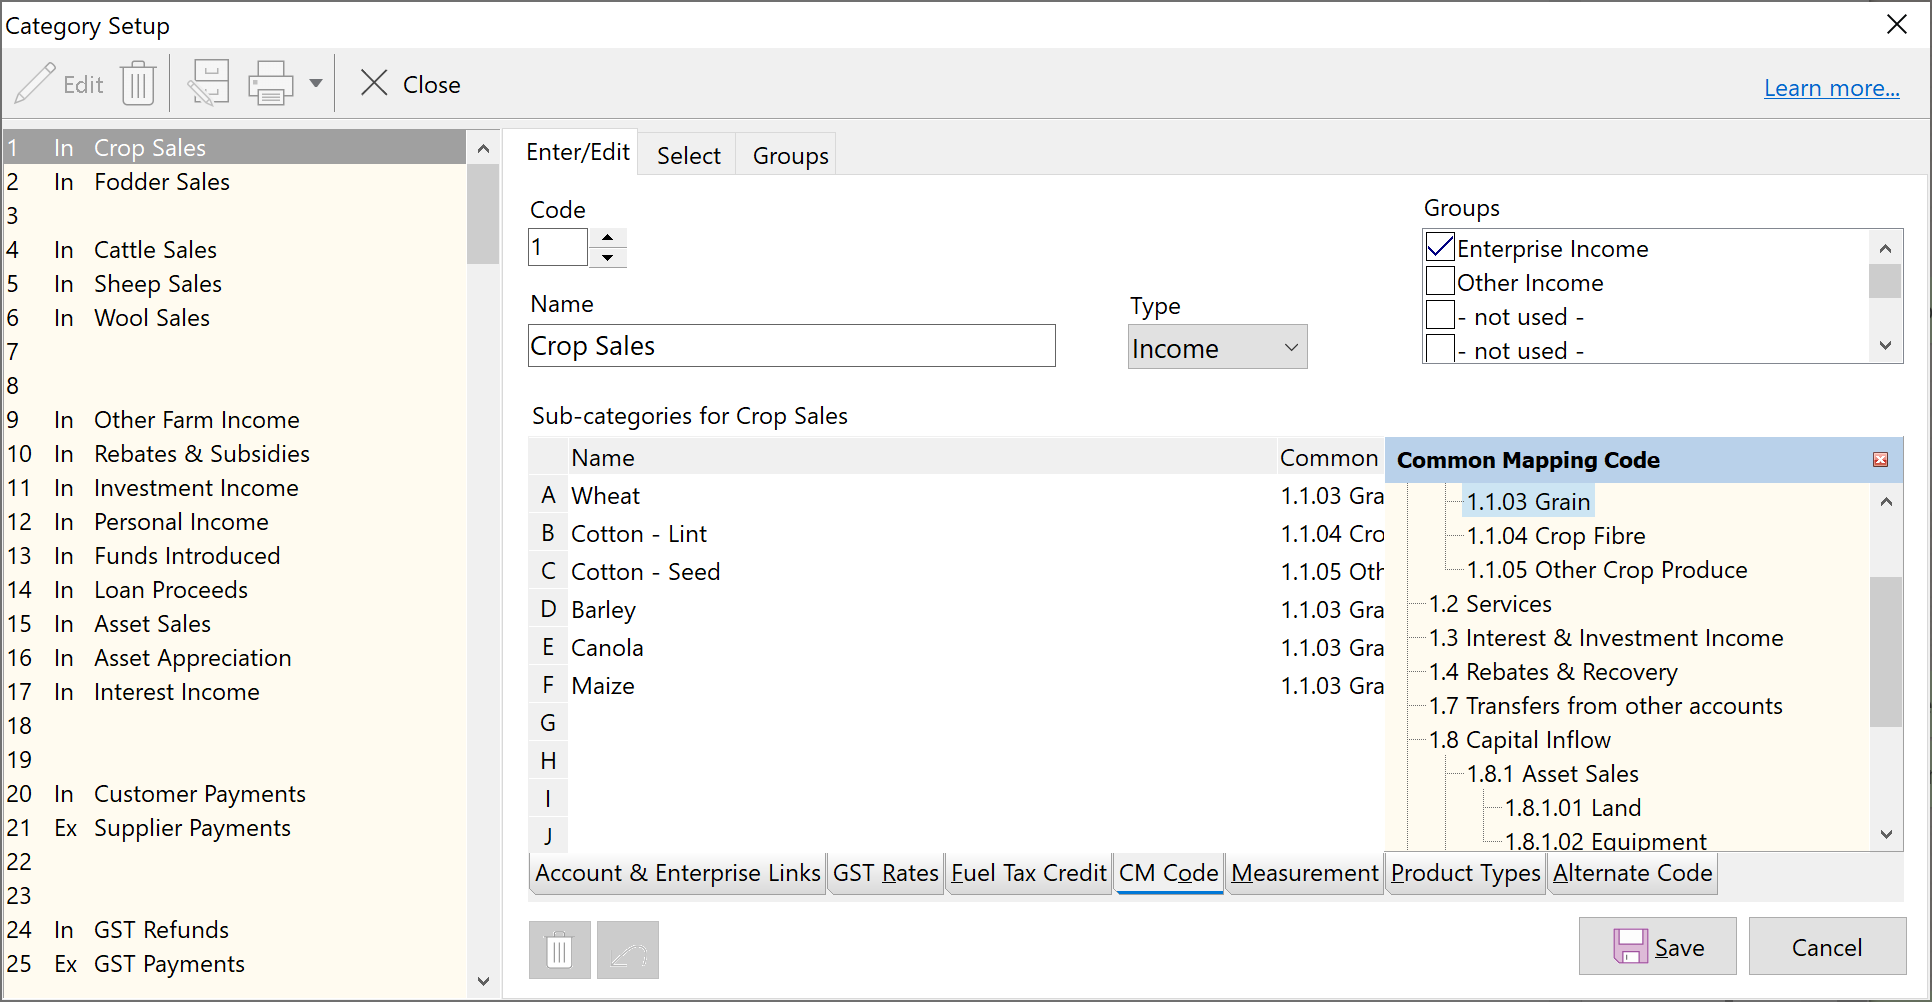
The CMC are arranged in a hierarchical structure with a number of levels. There are a number of codes created in the CMC table that are not used yet, but provide a framework for future development of the Phoenix system. Sub-categories should be allocated to the highest precision level CMC available. That is, do not allocate to 1.8 Capital Inflow, instead allocate to 1.8.1 – 1.8.4 available in the next level of this code. Phoenix will prevent allocation to a particular code if a higher precision level is available.
Sub-categories should be allocated to CMC’s in the range of 1 to 3. CMC 9 is a special case that is available and will be discussed later.
Incomes
CMC’s 1.1 to 1.4 are provided to give the report more detail, they are all handled as non-capital incomes for the purposes of the ratio report. Users may choose to allocate incomes to any of these codes as they see fit. If reports will be compared to others in a group, then consultation within the group, or with an advisor will determine within that group how these particular divisions will be used.
1.8 is for Capital incomes, the following will explain the break-up within Capital;
•1.8.2 Loans recovered the capital repayment of loans made from the Phoenix user to other entities.
•1.8.4 Loans received is for the money received when the Phoenix user has borrowed from another entity or financial institution.
•1.8.3 Capital Injected is for money received (not borrowed) from other entities.
Expenses
2.1 Purchases is for all business expenses that are not finance, Taxation, operators labour or Capital. 2.1.1 – 2.1.4 are provided to give the report more detail, they are all handled as operational expenses for the purposes of the ratio report. Users may choose to allocate incomes to any of these codes as they see fit. If reports will be compared to others in a group, then consultation within the group, or with an advisor will determine within that group how these particular divisions will be used. A guide to their use may be as follows;
•2.1.1 Direct Enterprise Expenses for those expenses directly related to specific enterprises within the business.
•2.1.2 Running Expenses for those expenses which are not overhead, but not directly attributable to particular enterprises. Examples would be repairs or fuel
•2.1.3 Overhead Expenses for those expenses that are genuinely overhead, e.g.. Office admin, or accounting fees.
•2.1.4 Wages and associated costs for any staff other than the business owners.
2.2 Finance, and 2.3 Taxation are self evident with the comment that loan repayments should be separated into their capital and interest components. The interest should go to a sub-category allocated to 2.2.2, while the capital goes to a sub-category allocated to 2.8.4.
2.4 Operators Labour is salaries paid to the owners, or drawings taken by the owners. If reports will be compared to others in a group, then consultation within the group, or with an advisor will determine what should be allocated to this code for consistency within the group.
2.8 is for Capital expenditure, the following will explain the breakup within Capital;
•2.8.2 Monies Lent for the capital extended for loans made from the Phoenix user to other entities.
•2.8.4 Loan repayments is for the capital repaid when the Phoenix user has borrowed from another entity or financial institution. Note this should not include any interest payments.
•2.8.3 Capital Extracted is for money given (not loaned) to other entities.
Intangible
The only intangible to be used currently is 3.2 Depreciation. This should be allocated to any expense sub-category used for depreciation of Asset accounts.
Unreported
If there are any sub-categories in the Phoenix system that are totally unrelated to the transactions of the business being reported, then they can be allocated to 9 Unreported. These transactions will take no part in a standardised report.
NOTE. If you plan to use the standardised reports, it is important that every sub-category is allocated one of the CMC’s. From Category Setup, print the detailed category report to confirm that these allocations are all made.
To map the common codes to your categories:
1.Click the  button from the Toolbar then select Categories.
2.Click on the CM Code tab:
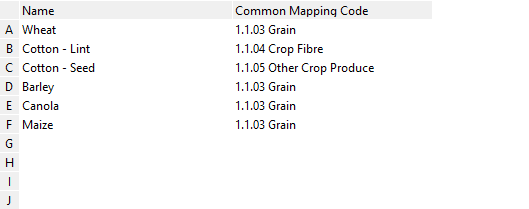
3.For each of your sub-categories click onto the “mapping” field and choose the appropriate mapping code.
Hint: The common codes will be displayed in a numbered format. (e.g.. Mapping Code “1 Income” is divided into three parts “1.1 for Sales”, “1.2 for services” and “1.3 for interest”, etc). When selecting a code from the list always select the highest precision level to get the most out of your reports. (e.g.. Don’t just select “1 Income” make sure you select what type of income this relates to “1.1 for trading”)
Save the categories as you are making the changes.
Creating the Ratio Report
IMPORTANT: Ensure you have mapped all required categories to a “Common Mapping Code” before producing the report.
1.Select the  button from the Toolbar
2.Choose the Ratio Report
3.Select the period/s you wish to report on (maximum of five years available). The periods offered will cover whatever business period you are running in Phoenix. (e.g.. If you are running Phoenix using a financial year, the year/s in the report will be from Jul – Jun).
4.Click OK and the report will be generated
Formulas behind the ratios
Earning Capacity |
|
|
Operating Profit to Total Assets |
= |
Operating Profit / Total Assets X 100 |
Business Return to Net worth |
= |
Business Return / Net Worth X 100 |
Financial Stability |
|
|
Loan Interest to Net Income |
= |
Interest /Net Business Income X 100 |
Times Interest Earned |
= |
Operating Profit / Interest |
Debt to Operating Profit |
= |
Total Liability / Operating Profit |
Debt to Total Asset |
= |
Total Liability / Total Assets X 100 |
Debt to Net worth |
= |
Current Liability / Net worth X 100 |
Current Assets to Current Liab |
= |
Current Assets / Current Liab X 100 |
Cash to Current Liabilities |
= |
(Cash at bank + Accounts Receivable + Stock Firm account if the account is in credit) / Current Liab |
Working Capital |
= |
Current Assets - Current Liab |
Working Capital to Total Assets |
= |
(Current Assets - Current Liab) / Total Assets X 100 |
Net worth Percentage |
= |
Net Assets / Total Assets X 100 |
Return on Assets |
= |
Farm Operating Profit before interest / Closing assets |
Turnover Ratio |
= |
Gross profit / Total opening assets |
Gross Margin Ratio |
= |
Gross margin / Gross profit |
Overhead Ratio |
= |
(Overheads + Drawings) / Gross profit |
Finance Ratio |
= |
Interest / Gross profit |
Interest Coverage Ratio |
= |
Farm Operating Profit before interest / interest expense |
Fixed Charge Coverage Ratio |
= |
(Farm Operating Profit before interest + lease) / (interest expense + lease) |
Please Note: When comparing the Ratio Report to the Net Worth report, you will notice an anomaly in the Total Assets and Total Liabilities. In the Ratio Report there is a distinction between Cash at bank and Overdraft, i.e. there is a line for Cash at Bank in Current Assets and a line for Overdraft in Current Liabilities. In Net Worth this is just reported in Assets - Current as a net value under Cash at the bank or on hand, if cashed up its a positive value, if owing money then a negative value.