If you have Phoenix Livestock and your mapping projects are in the same dataset as your Livestock then grazing information can be displayed directly onto your maps.
Before you can utilise these views you first need to ensure objects on the map have been linked to paddocks created in Livestock.
Setup
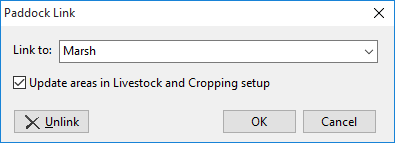
To create this link: •Launch Mapping and open the appropriate project. •On your Paddocks Layer, click the first paddock so it highlights in red. In Object Data click
•If you tick Update areas in Livestock and Cropping setup then the paddock size in Paddock Setup will be updated with the calculated area from the map. •When finished, click OK. Repeat this step for each paddock. |


There are four views available in Phoenix Mapping. They are:
Livestock Numbers
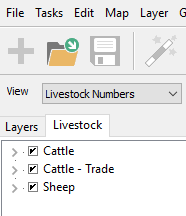
Livestock Numbers view will display the Classes and headcount of animals on each paddock. To show the Livestock Numbers view: •In the top left hand corner of the mapping window click
•Your Paddocks layer will now be labelled showing the Class/es and their headcount on each paddock. •In the Livestock tab that is now available you can filter the view to show specific classes by unticking the unwanted classes or even animal types. •You can print this view by clicking File on the pulldown menu and selecting Print. •To revert back to general Mapping, click NB: When in any other view other than Mapping you cannot edit/modify the map itself.
|
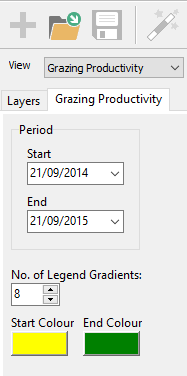
Grazing Productivity
The Grazing Productivity view renders paddocks on a colour gradient based on the extent of grazing that has been taken from each paddock over a specified period. In simple terms, which paddocks have sustained the most amount of grazing. To show the Grazing Productivity view: •In the top left hand corner of the mapping window click
•In the Grazing Productivity tab enter the Start and End date for the period you wish to report on. •The No. of Legend Gradients: is the number of coloured increments to show in the legend to cross reference colours on the map to their values. •Start Colour and End Colour determines the colour gradients used to denote variances in results between paddocks.
•Click the Layers tab and below the Paddocks layer will be the colour gradient legend with their corresponding values. The number of gradients shown is determined by the No. of Legend Gradients selected in the Grazing Productivity tab. •You can print this view by clicking File on the pulldown menu and selecting Print. •To revert back to general Mapping, click
NB: When in any other view other than Mapping you cannot edit/modify the map itself.
|
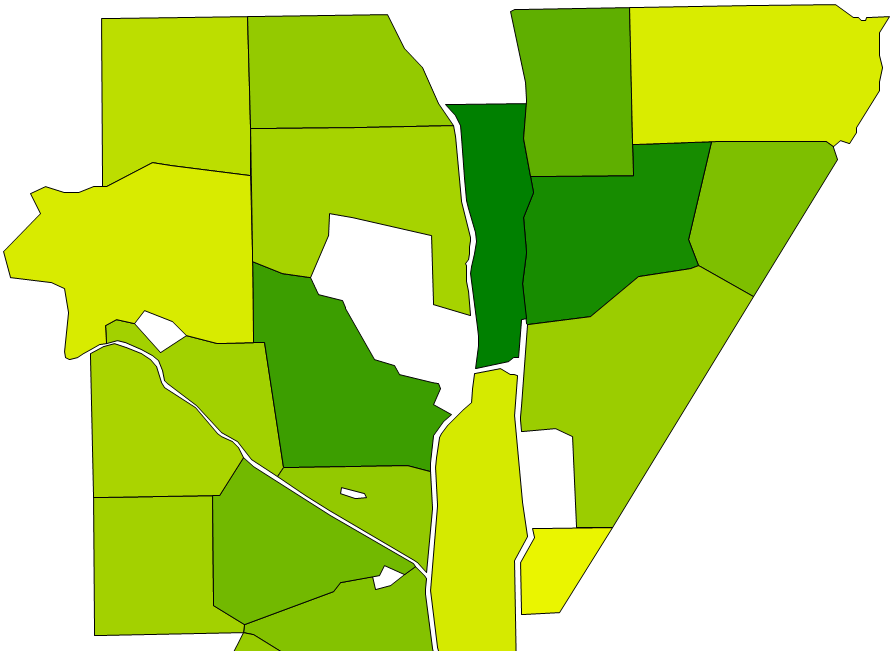
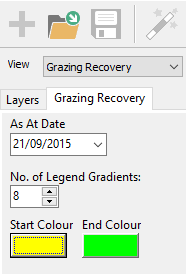
Grazing Recovery
The Grazing Recovery view renders paddocks on a colour gradient based on the number of days since the paddock was last grazed. To show the Grazing Productivity view: •In the top left hand corner of the mapping window click
•In the Grazing Recovery tab enter the As At Date you wish the map to represent. •The No. of Legend Gradients: is the number of coloured increments to show in the legend to cross reference colours on the map to their values. •Start Colour and End Colour determines the colour gradients used to denote variances in results between paddocks. •Click the Layers tab and below the Paddocks layer will be the colour gradient legend with their corresponding values. The number of gradients shown is determined by the No. of Legend Gradients selected in the Grazing Recovery tab. •You can print this view by clicking File on the pulldown menu and selecting Print. •To revert back to general Mapping, click
NB: When in any other view other than Mapping you cannot edit/modify the map itself.
|
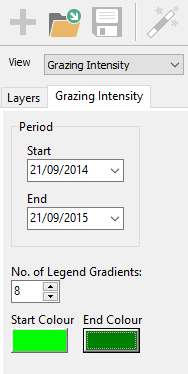
Grazing Intensity
The Grazing Intensity view renders paddocks on a colour gradient based on their peak stock loading (i.e. the highest LSU/ha over the grazed period). To show the Grazing Intensity view: •In the top left hand corner of the mapping window click
•In the Grazing Intensity tab enter the Start and End date for the period you wish report on. •The No. of Legend Gradients: is the number of coloured increments to show in the legend to cross reference colours on the map to their values. •Start Colour and End Colour determines the colour gradients used to denote variances in results between paddocks. •Click the Layers tab and below the Paddocks layer will be the colour gradient legend with their corresponding values. The number of gradients shown is determined by the No. of Legend Gradients selected in the Grazing Productivity tab. •You can print this view by clicking File on the pulldown menu and selecting Print. •To revert back to general Mapping, click
NB: When in any other view other than Mapping you cannot edit/modify the map itself. |