•Launch Phoenix.
•Click on the Weather button on the Toolbar.
You will be presented with the main screen of Phoenix Weather.
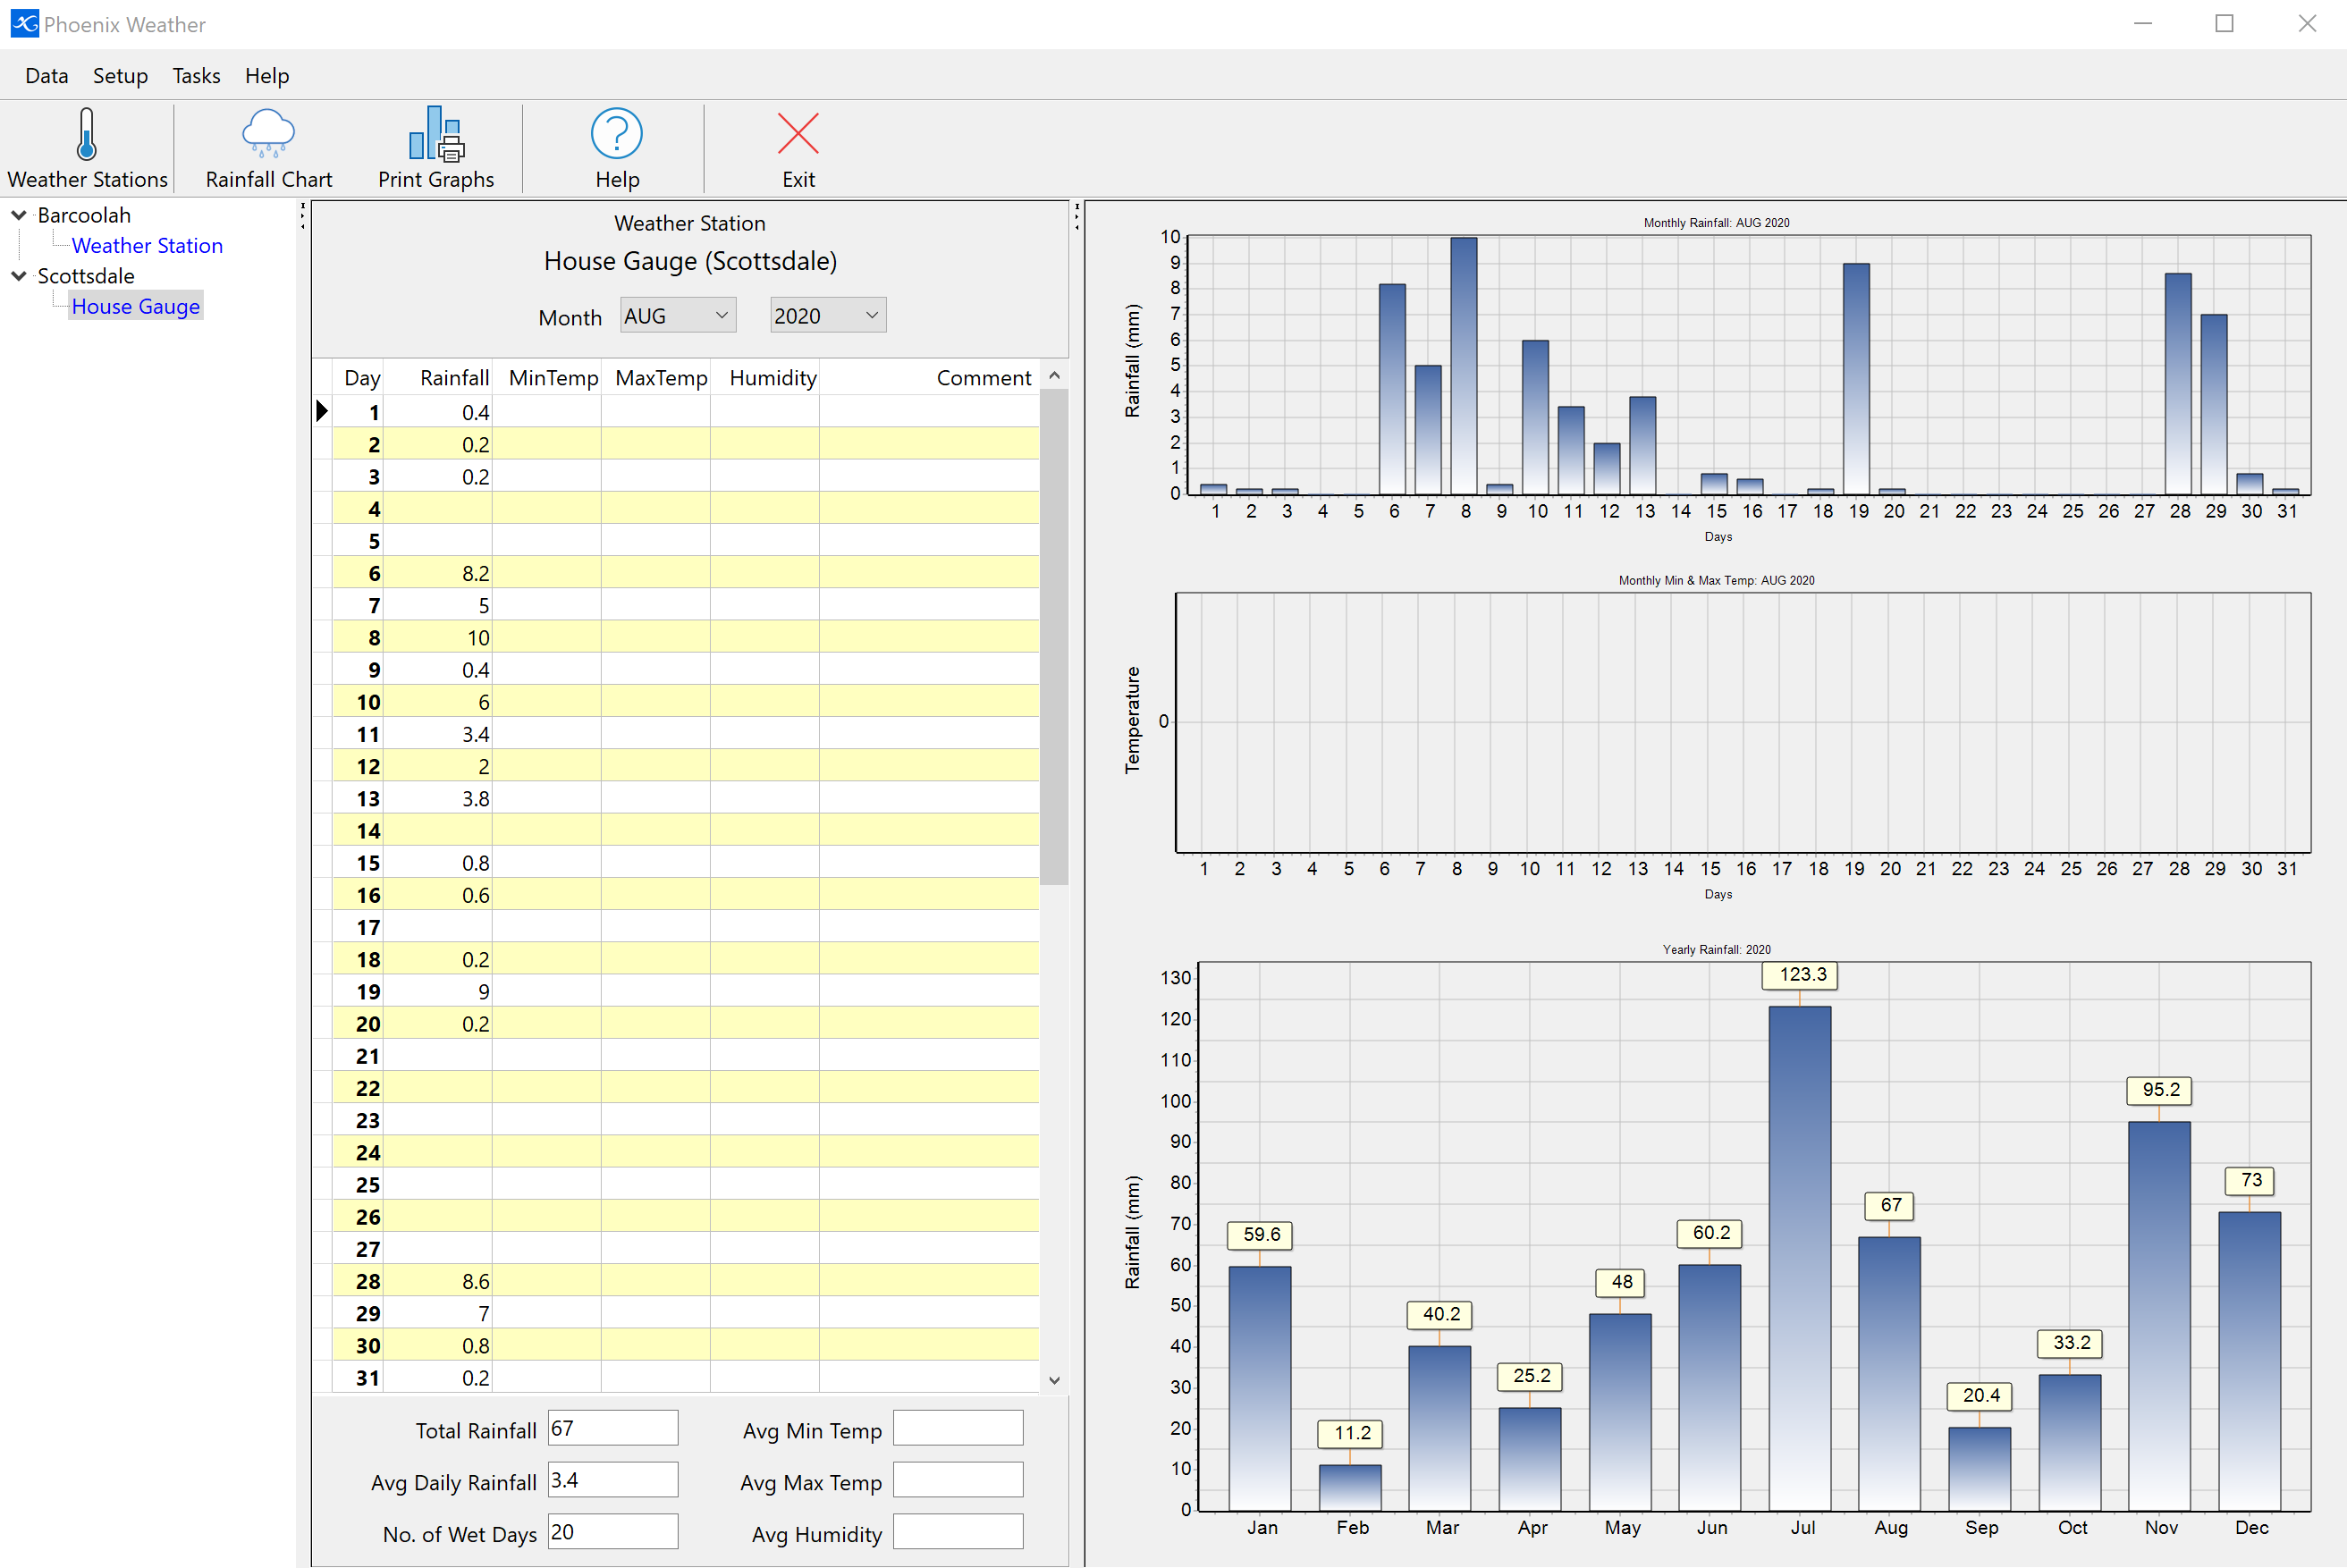
At the very top of the screen is the Toolbar. The buttons are:
 Setup Weather Stations and Properties
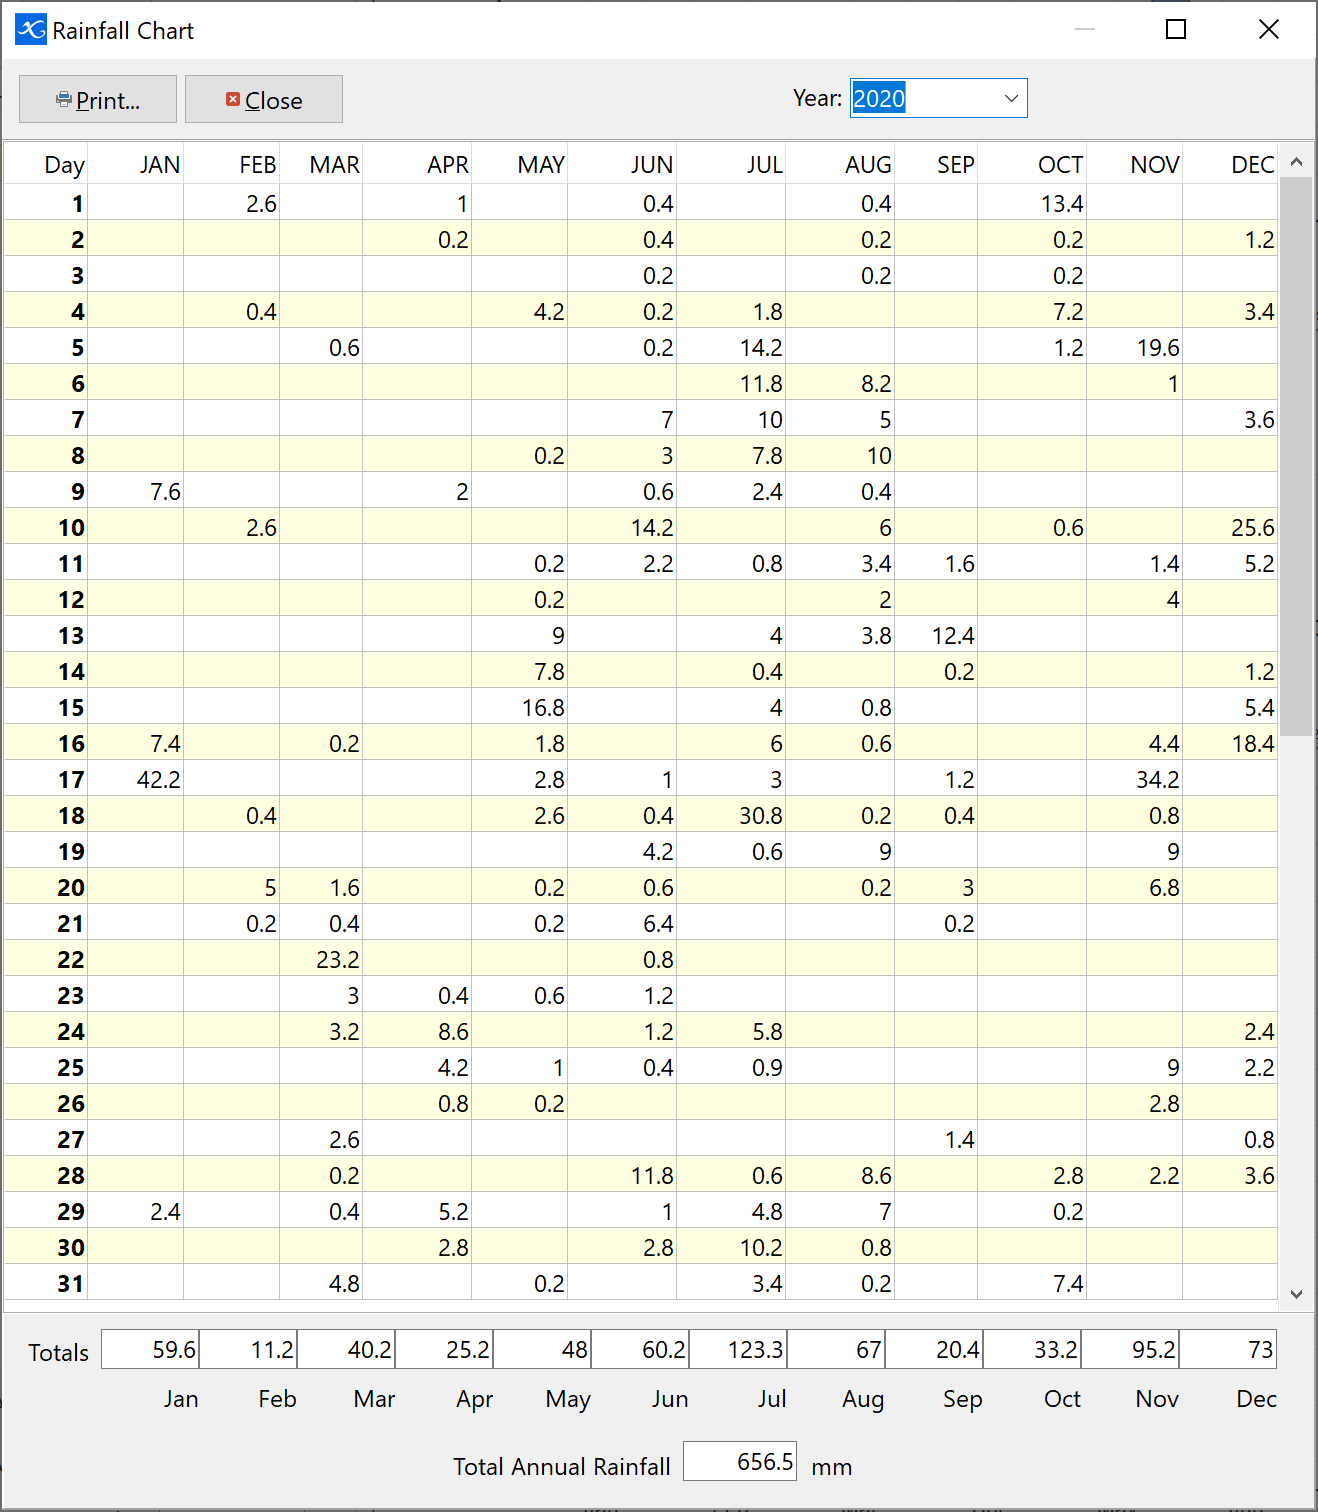 View and print rainfall summary
 Print the Graphs as they appear in the main screen
 Exit Phoenix Weather module
Below the Toolbar is the main working area of the module. In the left hand panel is the Property and Weather Station tree view menu. Weather Stations will appear below their respective Property. Properties will be displayed in black and Weather Stations in blue. The menu is collapsible meaning Weather Stations listed below properties can be hidden from view. Beside a Property that has a Weather Station setup will be  . If you click on the the menu will expand out displaying the Weather Stations set up under that Property.
The middle panel is the main information entry screen. All data is recorded in this panel. At the top is a Month/Year menu. In the centre is the data entry table. At the bottom is a summary for that month. Displayed will be Total Rainfall, Average Daily Rainfall, Number of Wet Days, Average Minimum & Maximum Temperature and Average Humidity.
The right hand panel displays the weather summary graphs with the Current Months Rainfall and Minimum and Maximum Temperatures. Also displayed will be the progressive annual rainfall.