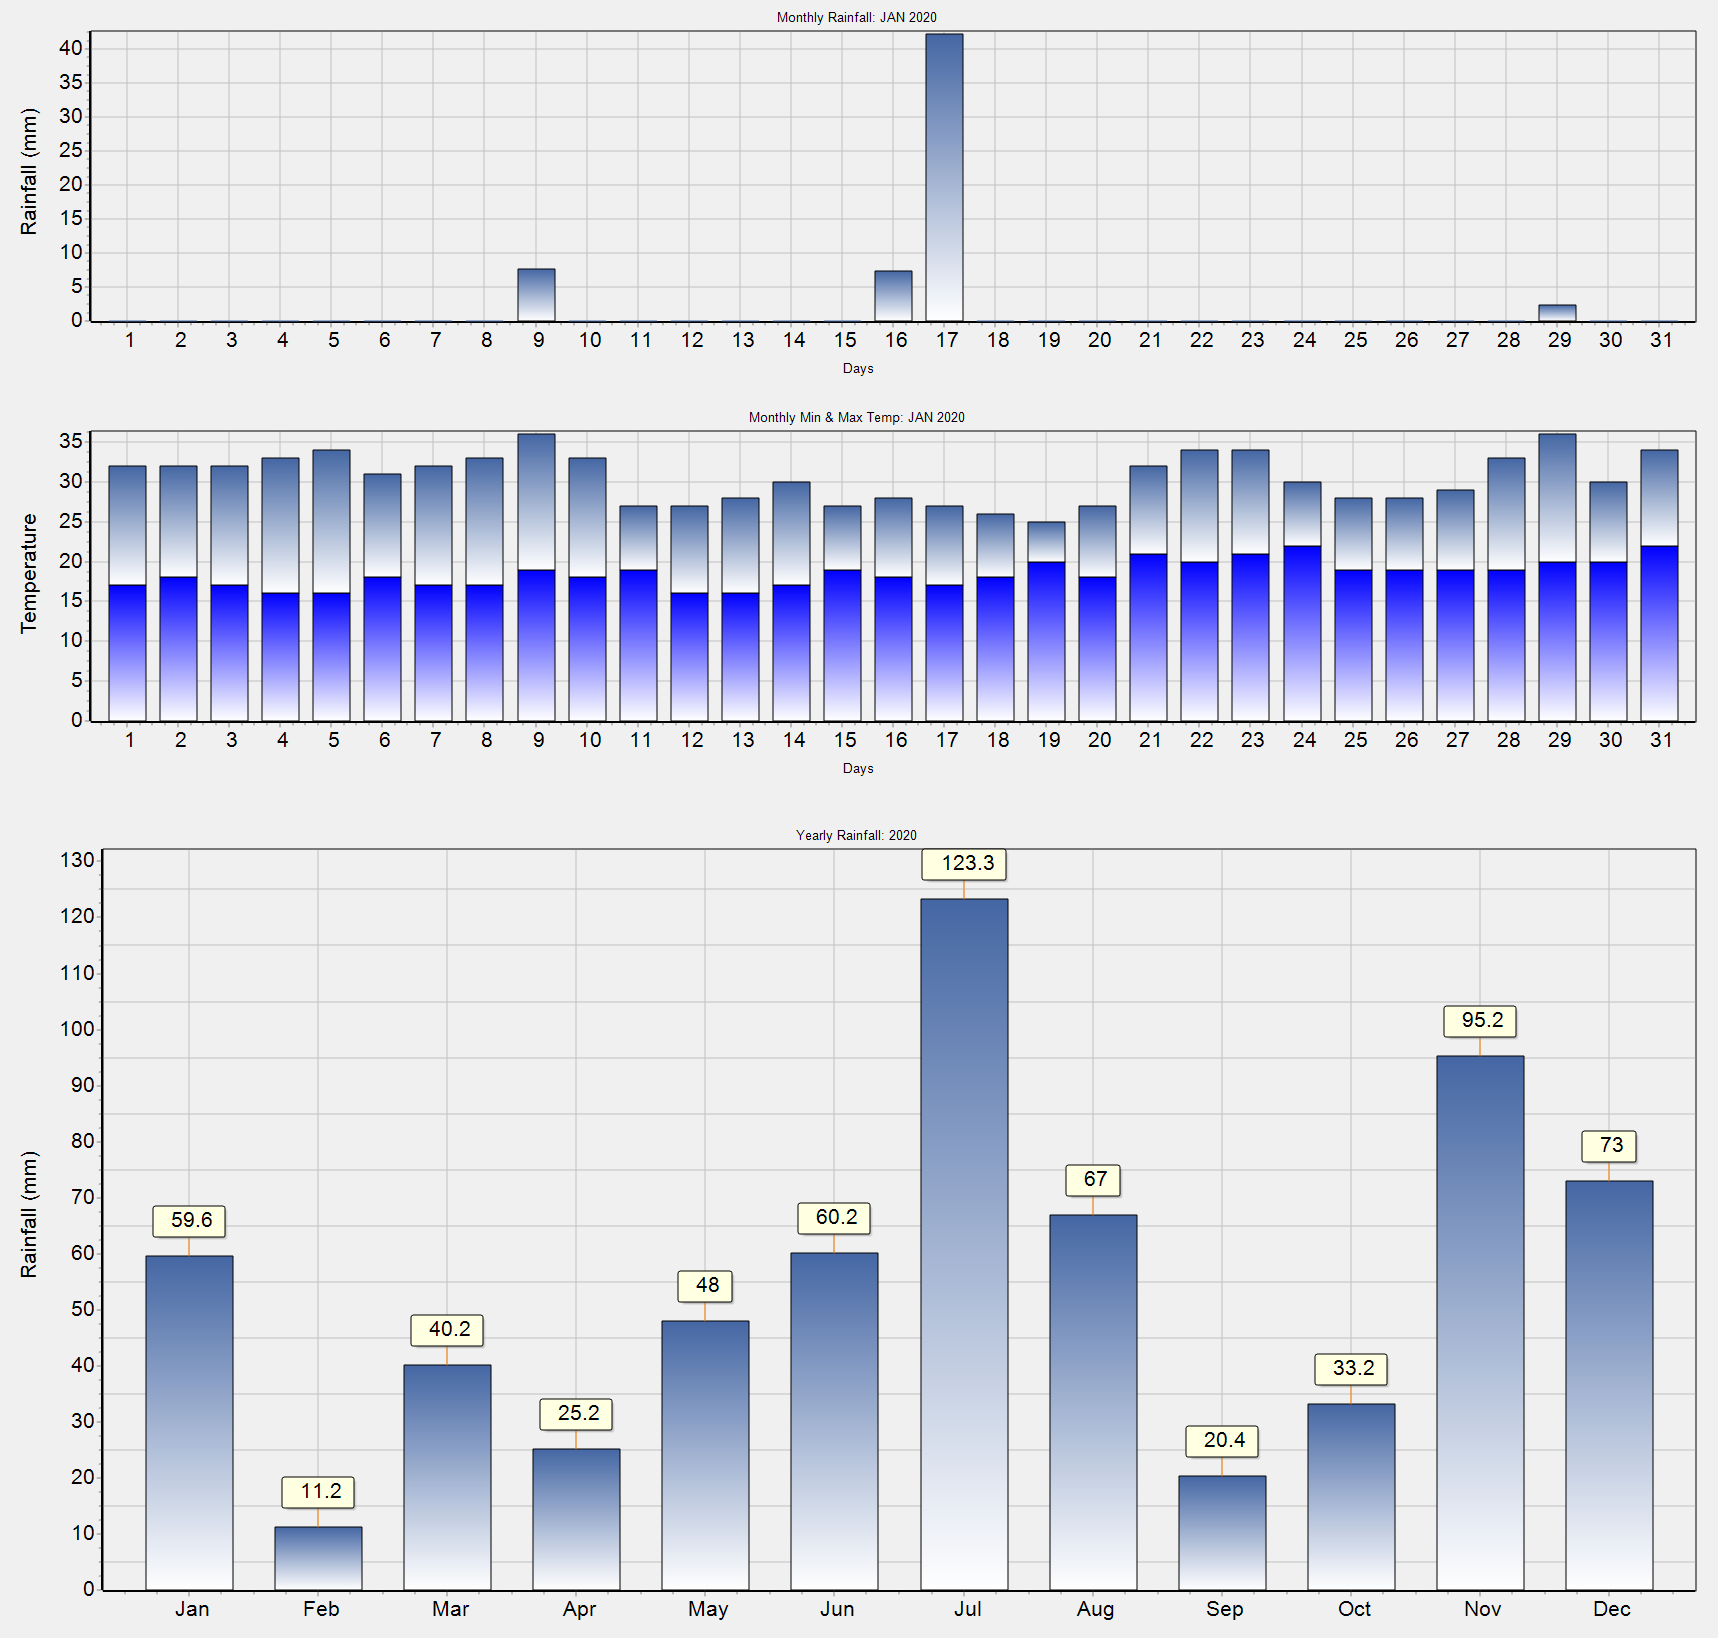
Weather Summary is displayed graphically in the right hand panel. Clicking the Print Graph button on the Toolbar will print the graphs currently displayed.
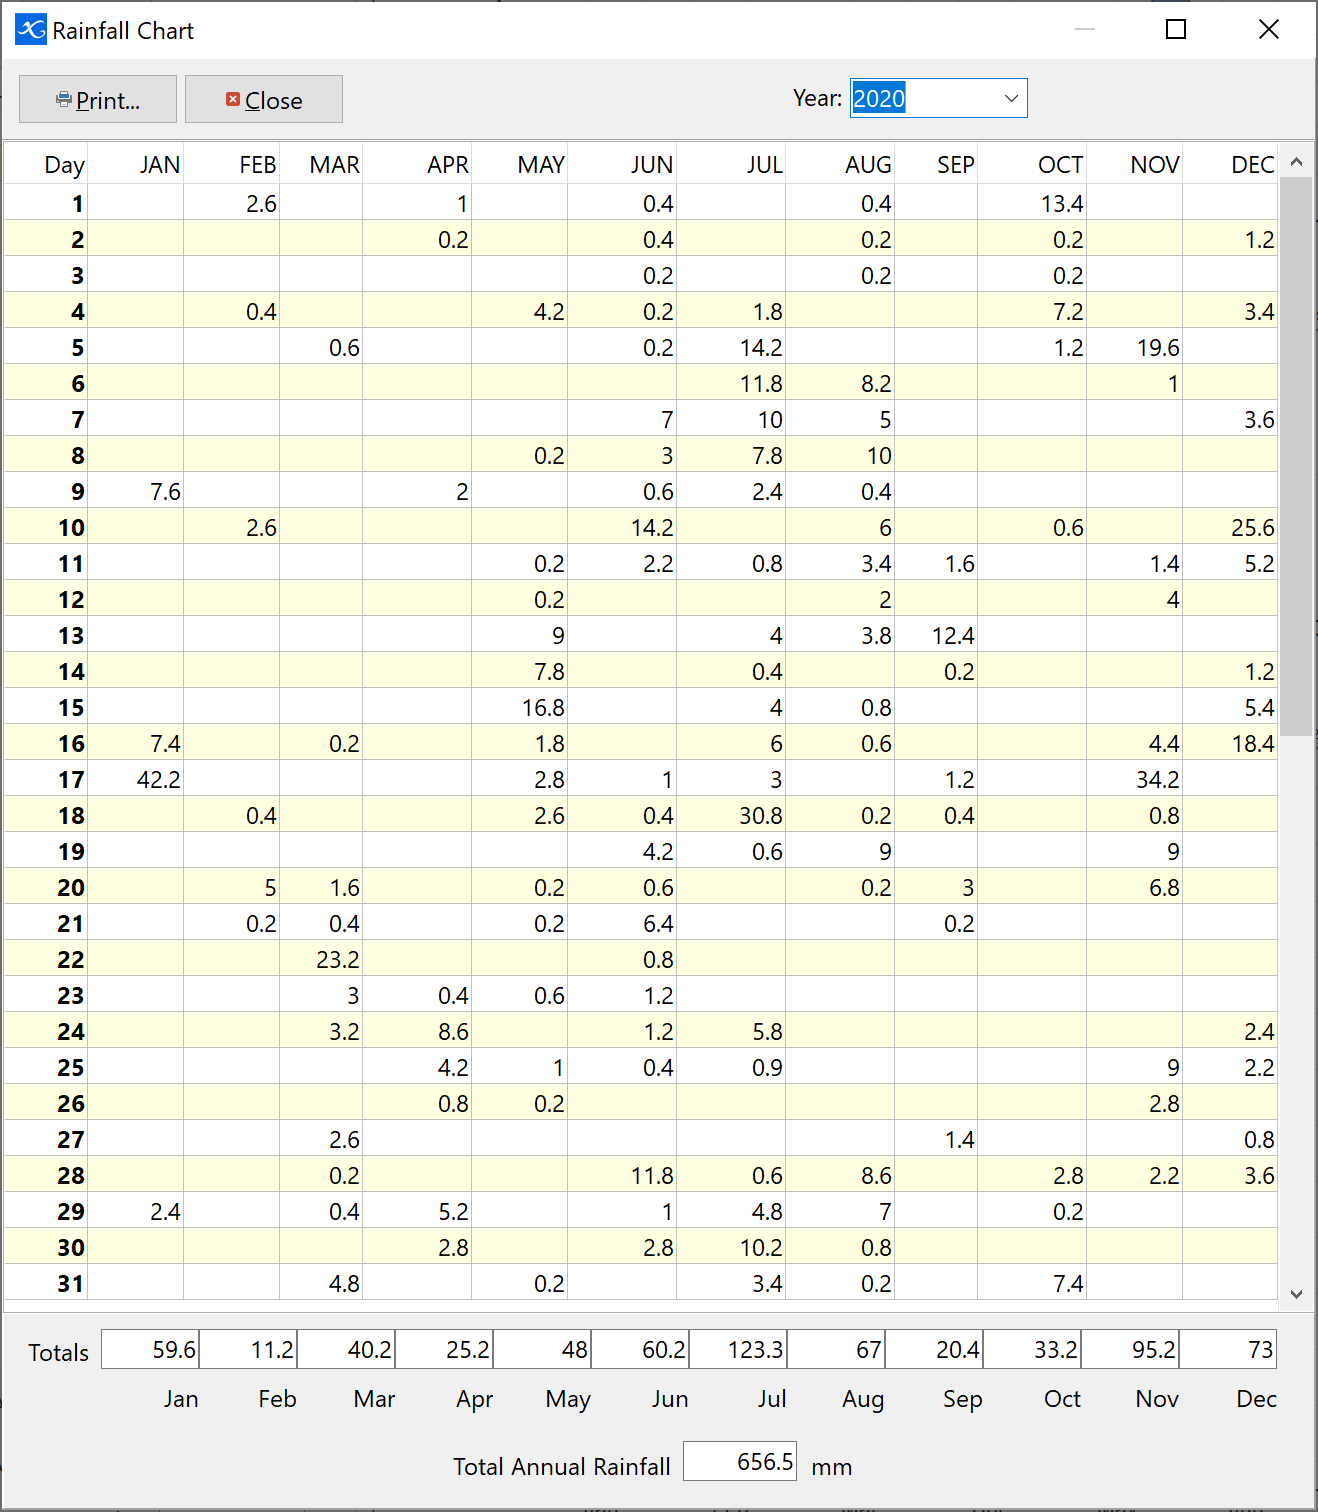
Rainfall Summary Chart is available by clicking on the Rainfall Chart button on the Toolbar. The window that appears will be an annual rainfall summary displaying each rainfall event, total rainfall for each month and the total annual rainfall. To view past history, click the Year selection window in the top right hand corner. From the drop-down list select the year in question. Clicking the Print button in the top left hand corner will print the summary page.