The Grazing Benchmarks report compares recent performance against historical performance for a variety of user defined parameters.
To generate a Grazing Benchmarks report:
•Click  on the toolbar.
•Select Grazing Benchmarks in the Reports menu.
•Work through each menu making selections as required. The Date menu sets the period for which the report will be generated.
•The key to producing a tailored Grazing Benchmarks report is contained in the Options menu and time should be spent understanding each function that is available.
•When finished, click Generate.
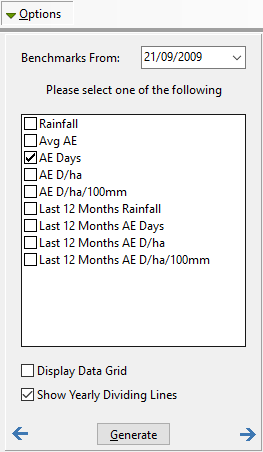
Options
Benchmarks From This is the date from which benchmark data will be generated. Rather than use all of history to calculate benchmarks you have the option to set from what period you want to compare your current performance. This can be important as you may want benchmarks since a change has occurred in your grazing system. Next is listed all the parameters available from which to plot current performance against historical benchmarks. By the nature of the information being displayed you can only select one value per report.
Display Data Grid In addition to the graph you can display the numeric values as plotted on the graph. This data will appear in a separate table after the graph.
Show Yearly Dividing Lines This option displays a vertical line for each 1st January that occur on the graph. This is a visual cue to denote calendar years on the graph. |
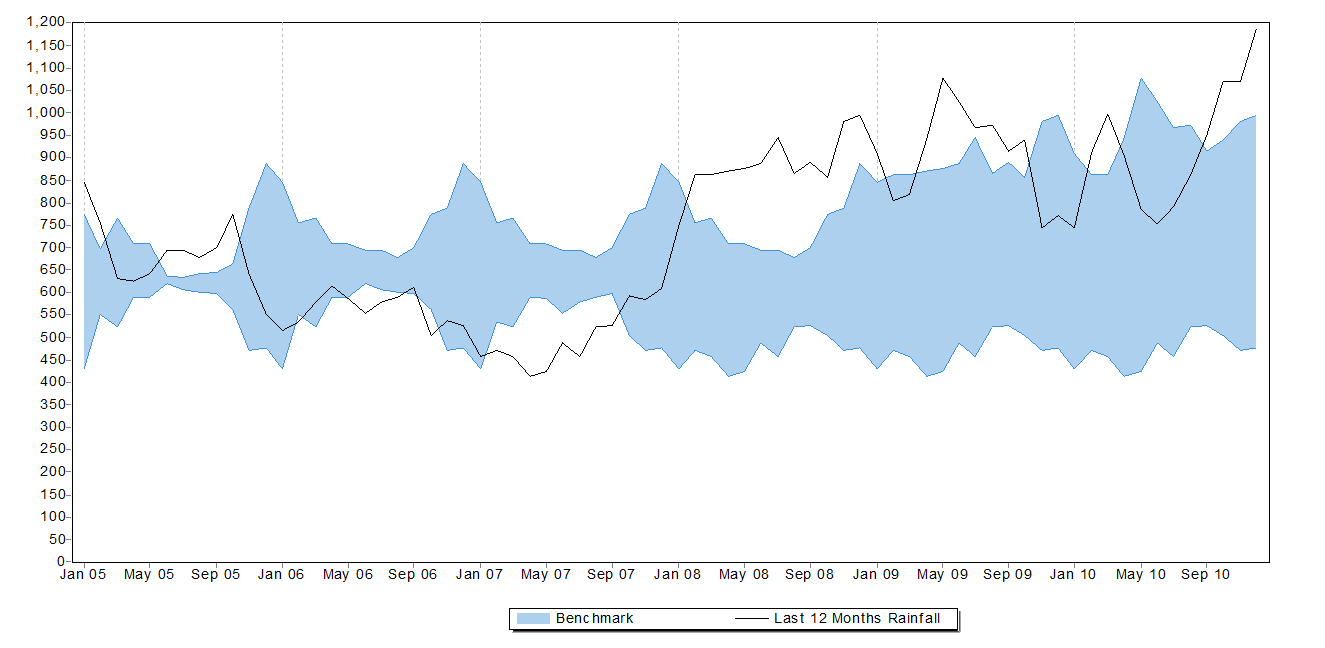
The Grazing Benchmark report plots a single black line for the results of the parameter chosen in the Options menu.
The shaded area represents the highest and lowest value achieved for each month from the date entered for Benchmarks From in the Options menu. This allows you to compare current performance directly against historical performance.
If the black line extends beyond the blue shaded area then this represents a new high or low for that month for the reported benchmark history. This new high or low will then form the extent of the shaded area for that month for subsequent years.