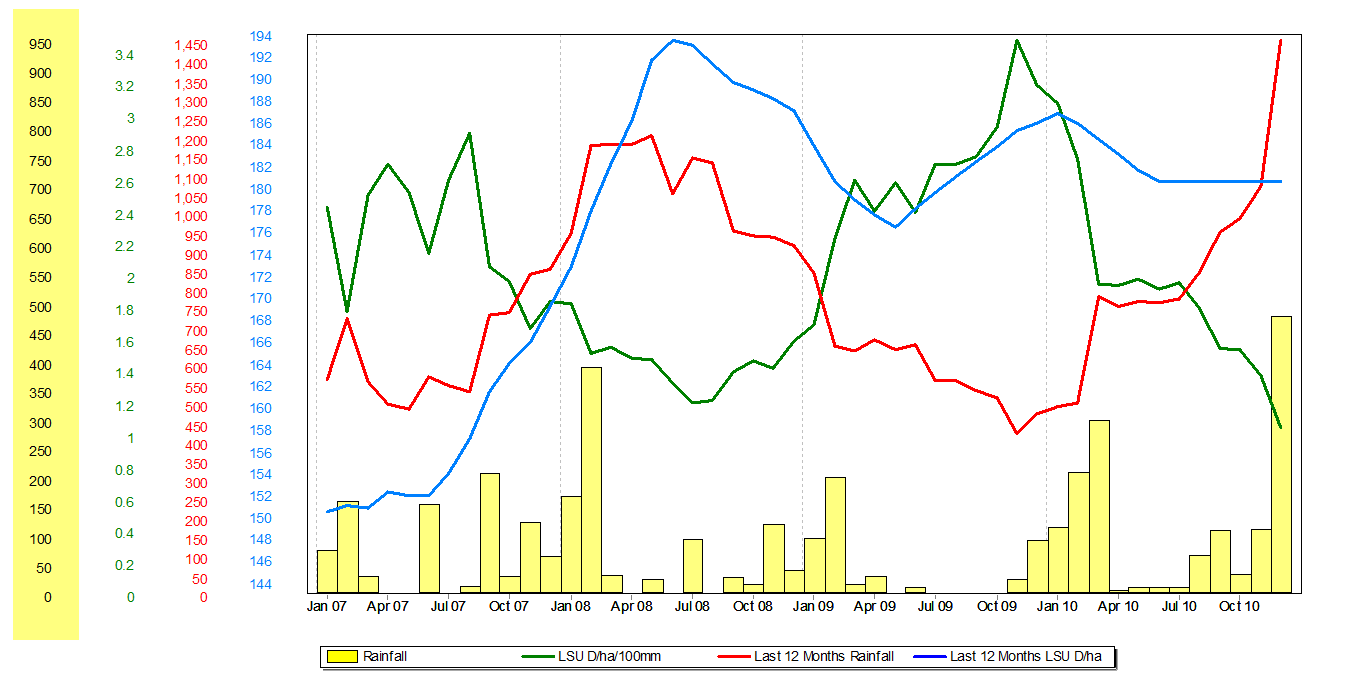
The Grazing Performance report provides the ability to plot up to four measures of grazing performance on a single graph. The inter-relationship between these measures of grazing performance can be identified by consolidating into a single information source. The graph can then be generated for any period in time enabling you to see short, medium and long term causes, effects and trends.
To generate a Grazing Performance report:
•Click  on the toolbar.
•Select Grazing Performance in the Reports menu.
•Work through each menu making selections as required. The Date menu sets the period for which the report will be generated.
•The key to producing a tailored Grazing Performance report is contained in the Options menu and time should be spent understanding each function that is available.
•When finished, click Generate.
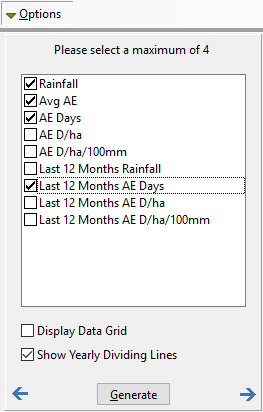
Options
Listed are all the values available to plot on the Grazing Performance graph. To ensure that what is created is legible, you can choose up to four values.
Display Data Grid In addition to the graph you can display the numeric values as plotted on the graph. This data will appear in a separate table after the graph.
Show Yearly Dividing Lines This option displays a vertical line for each 1st January that occurs on the graph. This is a visual cue to denote calendar years on the graph.
|