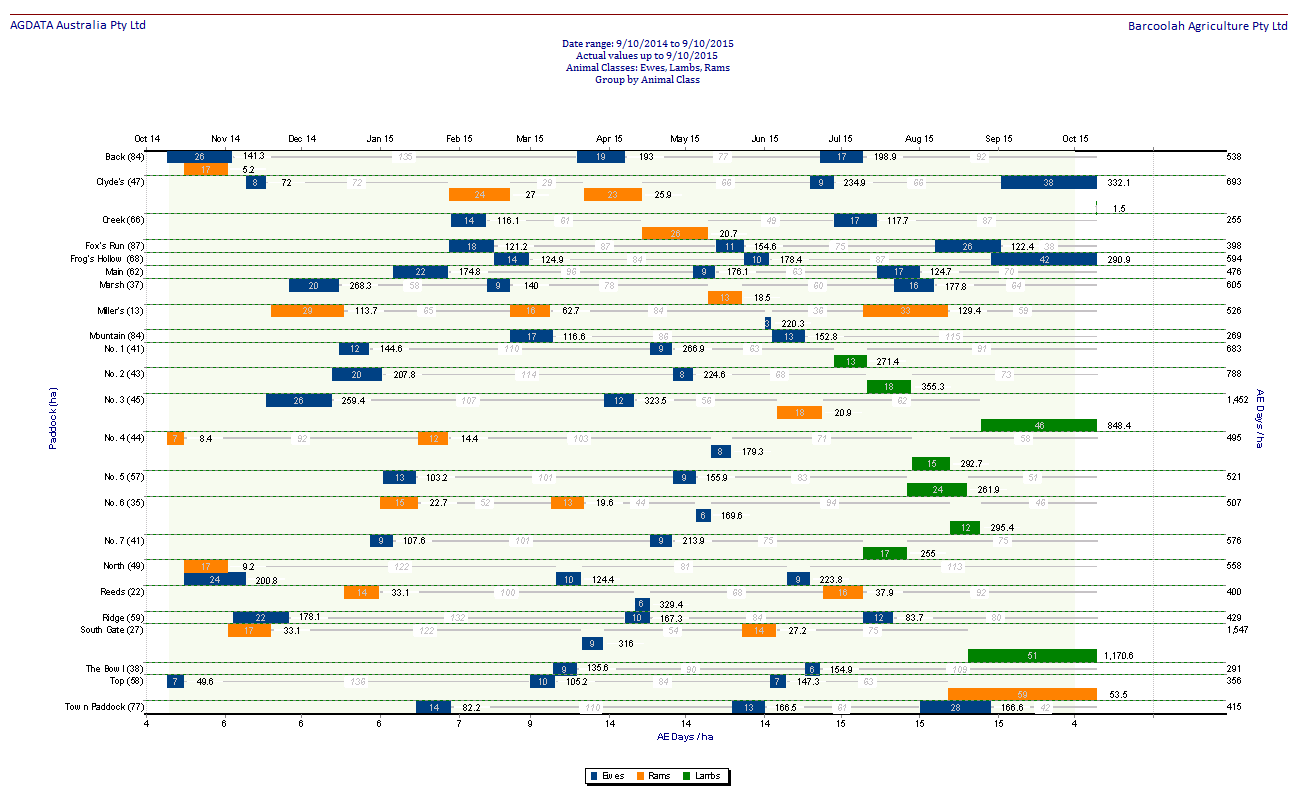
Phoenix Livestock generates a traditional grazing chart with some noted additions. Grazing charts can be generated for any user defined period. This can include plotting actual historical charts for what has occurred, blank charts for future plans and a combination of both on the one chart.
To generate a grazing chart:
•Click  on the toolbar.
•Select Grazing chart in the Reports menu.
•Work through each menu making selections as required. The Date menu sets the period for which the grazing chart will be generated.
•The key to producing a tailored grazing chart is in the Options menu and time should be spent understanding each function that is available.
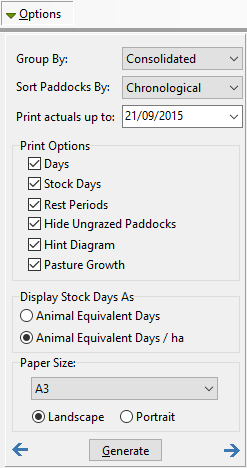
Options
Group By Group By has three options: Consolidated – A single bar per location will be used to represent all animals. Type – Separate bars per location will represent each Animal Type. These bars will be colour/pattern coded per Animal Type setup. Class - Separate bars per location will represent each Animal Class. These bars will be colour/pattern coded per Animal Class setup.
Sort Paddocks By Sort Paddocks By has two options: Chronological – The order in which the paddocks were grazed from the date selected in the Date menu. Alphabetical – Paddocks will be listed in alphabetical order.
Print Actuals Up To This is a date the grazing details will be printed up to. The grazing chart however may be generated for a longer period. This allows a grazing chart to be created that has actuals as well as vacant space to plot a future grazing plan.
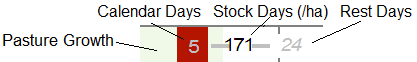
Print Options Days – Displays the number of days each bar on the grazing chart represents. Stock Days – Displays the Stock Days each bar on the grazing chart represents. Rest Period – Displays the days rest between each grazing event for each location. Hide Ungrazed Paddocks – If a paddock has not been grazed during the reporting period, you can exclude these locations from the grazing chart. Hint Diagram – A diagram explaining the numbers that appear on the grazing chart.
Pasture Growth – Plots the pasture growth periods on the grazing chart. This is drawn from Property Setup.
Display Stock Days As For each bar and location on the grazing chart you have two options to display stock days; total and /ha (assuming Stock Days is selected above). Incidentally, the feed demand unit you select in the Units menu will display in this field.
Paper Size Grazing charts by their nature are large formats and typically are not conducive to being printed on A4. In the Options menu you can select a page size to print the grazing chart on. Whatever size is selected the print preview will be representative of that page size. Phoenix Grazing will fit the report results to the page size. This may result in the grazing chart appearing squashed and illegible. In this case select Options on the report menu and select a larger page size. Under Page Size there is a Custom option. This allows you to set a page size of any dimension up to 5m x 5m. While that may be a little excessive it does allow you to produce grazing charts greater than the typical calendar year. If you want to see trends for example, you could produce a 5 year grazing chart starting and finishing at any point in time. This may require a custom page size. If you are running a large number of paddocks, the Custom feature allows you to create an extra large height size to accommodate these paddocks. If producing a grazing chart larger than your printer, you have the option to save as a pdf then have a commercial printer print the grazing chart for you. Alternatively you can tile print these larger formats through your A4 or A3 printer. |