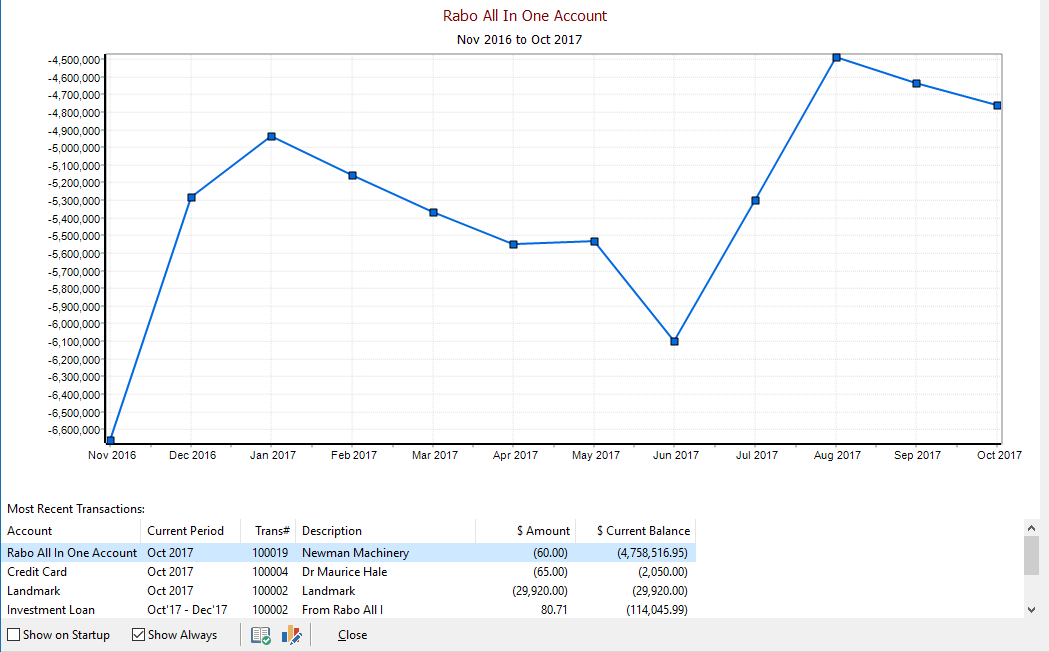
A graph is available on the opening screen of Phoenix that will display the current and recent account balances of your cash flow accounts. Optional is a table that will also identify the last transaction that was entered into each of those accounts. This lets you see at a glance what the current positions of your accounts are and what recent trends have been.
You can customise which accounts are shown in this graph and also if the graph is presented on startup or shown in the program at all.
To customise, right mouse click on the graph for options
The benefits include a current GST position and a cheque account balance when the program is started.
Here is an example of what the graph will look like

•If you wish to turn the graph off, untick the box called “Show on Startup”
•If you want the graph to be displayed always, tick “Show Always”
•If you have elected to turn the Graph off, you can access it via the “Tasks” menu then choose “Quick Account History”
•If you want to change the Graph, right mouse click over the top of it and you will be presented with Customise or Options. From Customise you can change the period which the graph display’s and the accounts shown beneath it. From Options you can show a Legend, Labels, or change the style from a Line to a Bar Graph.
See also: Management Dashboard